Discover the signs of an impending surge in Bitcoin’s volatility after a period of historic calm. Explore the potential catalysts, chart patterns, and expert insights shaping the cryptocurrency market’s outlook. Get insights into pending ETF applications, technical analyses, and historical trends in this informative article.”

Introduction
In recent times, the cryptocurrency market, especially Bitcoin, has experienced an unusually low period of volatility. However, there are indications that this historic lull might be coming to an end. Chart patterns and the cryptocurrency’s historical behavior are hinting at a potential spike in volatility. This article delves into the factors contributing to this possible breakout, including pending applications for Bitcoin exchange-traded funds (ETFs) and the aftermath of the 2022 crypto crash.
Potential Catalysts for Volatility
One key factor that could ignite a surge in Bitcoin volatility is the pending applications from major financial firms like BlackRock Inc. to establish the first spot Bitcoin ETFs in the United States. These applications could stimulate demand and trigger a significant market response. Conversely, investors are also keeping a close watch on the vulnerabilities exposed during the 2022 crypto crash. Recent attention has centered around the well-being of the Huobi exchange, associated with crypto mogul Justin Sun.
A forthcoming ETF verdict could disrupt the prolonged phase of market calm. Analysts from K33 Research suggest that the upcoming deadline for a Securities and Exchange Commission (SEC) response to an application from ARK Investment Management LLC on August 13 could serve as a catalyst for increased volatility. The SEC’s decision—whether to postpone, reject, or approve the application—has the potential to spark significant market movement.
Also Read : Data Patterns Q1 profit jumps 81.4% YoY to Rs 25.8 cr; share rises 3%
Chart Patterns and Technical Analysis

Bitcoin’s price chart reveals an interesting pattern known as a “falling wedge.” This pattern, characterized by a narrowing price range, has historically been viewed as bullish by chart analysts. Notably, a similar falling wedge pattern preceded a rally in June. Analysts emphasize that a break above the upper line of this pattern could intensify bullish sentiment among investors.
Tony Sycamore, a market analyst at IG Australia Pty, highlights positive technical indicators that suggest Bitcoin could rally towards $34,000. This optimistic outlook is rooted in the observed falling wedge pattern and other technical factors.
Historical Volatility and Market Behavior
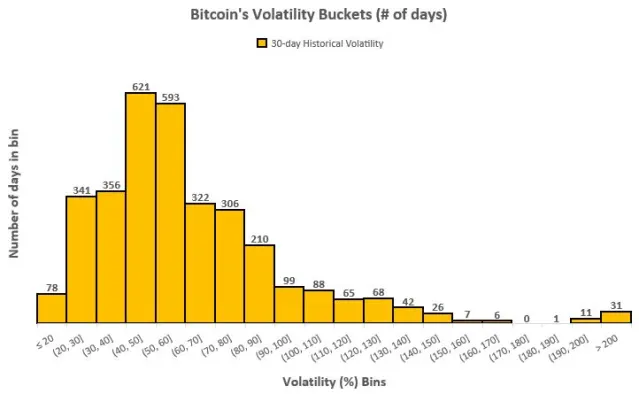
Bitcoin’s 30-day historical volatility, a measure of price fluctuations, is currently hovering near the 20 mark. This is a significant drop from previous levels. Bloomberg News analysis indicates that such low volatility (20 or less) has occurred only 2% of the time in the past decade. Furthermore, instances where volatility dropped below 20 followed by a subsequent rebound above this level have been rare but impactful. On average, Bitcoin saw a 16% price increase over the next 30 days in such instances.
Market Experts’ Perspectives

Terrence Yang, managing director at Swan Bitcoin, emphasizes Bitcoin’s underpriced nature in light of the potential influx of funds into US spot ETFs for the cryptocurrency. This dynamic could drive Bitcoin’s value upwards.
Additionally, a short-term correlation has emerged between the Nasdaq 100 Index of technology stocks and Bitcoin. This suggests that Bitcoin’s price movements could be influenced by shifts in equities, particularly as investors express concerns about the impact of elevated interest rates on markets.
Conclusion
In conclusion, the cryptocurrency market, particularly Bitcoin, appears to be on the cusp of breaking out of a period of historic low volatility. Factors such as pending ETF applications and the aftermath of the 2022 crypto crash are contributing to a potential spike in volatility. Technical analysis points to patterns that have historically led to rallies, and market indicators highlight the rarity and significance of the current low volatility period. As the market gears up for potential fluctuations, investors and enthusiasts alike are eagerly watching for the next chapter in Bitcoin’s turbulent journey.
FAQ: Bitcoin Volatility – Potential Spike and Market Dynamics
1. What is the current state of Bitcoin’s volatility? Bitcoin has been experiencing an unusually low period of volatility, with its 30-day historical volatility hovering around the 20 mark. This level of volatility has only occurred about 2% of the time in the past decade.
2. What factors could lead to a potential spike in Bitcoin volatility? Pending applications for Bitcoin exchange-traded funds (ETFs), especially from major firms like BlackRock Inc., could act as catalysts for increased demand and subsequent market volatility. Additionally, the aftermath of the 2022 crypto crash and concerns about exchange health are also contributing to the potential for volatility.
3. What chart pattern is being observed in Bitcoin’s price movement? Bitcoin’s price chart is showing a falling wedge pattern, characterized by a narrowing price range. This pattern has historically been considered bullish by chart analysts. A break above the upper line of the pattern could intensify bullish sentiment among investors.
4. How have historical instances of low volatility impacted Bitcoin’s price? Instances where Bitcoin’s volatility dropped below 20 followed by a rebound above this level have been rare but significant. On average, Bitcoin’s price has increased by around 16% over the next 30 days in such cases.
5. How are pending ETF applications influencing Bitcoin’s potential volatility? Pending applications for Bitcoin ETFs, such as those from BlackRock Inc. and ARK Investment Management LLC, are generating anticipation and potential for market movement. The SEC’s decision on these applications could spark volatility depending on whether they are postponed, rejected, or approved.
6. What is the short-term correlation between Bitcoin and the Nasdaq 100 Index? Recent trends indicate a positive correlation between Bitcoin and the Nasdaq 100 Index of technology stocks. This suggests that movements in equities could impact Bitcoin’s price, particularly as concerns about elevated interest rates affecting markets rise.
7. What are experts saying about Bitcoin’s current market dynamics? Market analysts and experts are optimistic about Bitcoin’s potential. They highlight the underpriced nature of Bitcoin, given the anticipated influx of funds into US spot ETFs for the cryptocurrency.
8. How are investors reacting to the possibility of increased volatility? Investors are cautiously watching for signs of increased volatility and taking risk management measures. Flows of funds in and out of the market are indicating a current trend of risk-off sentiment.
9. What should investors and enthusiasts expect in the near future? Bitcoin’s potential breakout from a period of low volatility could lead to significant price movements. Pending ETF decisions, chart patterns, and market dynamics are shaping the cryptocurrency’s future trajectory.
10. Where can I find more detailed information about Bitcoin’s volatility and market trends? For a comprehensive understanding of Bitcoin’s volatility, potential catalysts, chart patterns, and expert opinions, read the detailed article above. It covers the current state of the market and what could drive future developments.